

Why GPT Thought I Don’t Like Classical Music
Who likes being put into a box? That happened to me recently from an unexpected source while I was planning a trip to Rome. The AI’s suggestions on what I should definitely see were excellent. And then it said:
“Even if you are not fans of opera or church music, there are many classical concerts in Rome in January…”
Wait… what?!
Naturally, I wanted to know how it had arrived at that assumption. The explanation was statistics and heuristics: my word choice (!), my focus, my way of asking questions. Among other things, it explained to me:
“People who primarily plan Rome around antiquity, underground sites, logistics, and efficiency are often not the type with a strong interest in opera or church music.”
And just like that, I was in a box.
As a big fan and user of data and statistics, I can’t really be mad at GPT for this. The assessment was based on a plausible statistical inference. People who plan their trips with a similar focus and use words like “cool,” “practical,” or “works well” often belong to groups that culturally position themselves differently from opera or classical music audiences.
So the question is not whether I was judged incorrectly here, but rather up to what point such general assessments are useful and from which point onward they might become harmful to individuals in our society.
How do such conclusions come about in the first place?
In social research, it has long been established that cultural preferences are connected to lifestyle, education, value orientations, and social position. One of the best-known models in this context is the Sinus Milieus, developed in Germany in the early 1980s by the Sinus Institute. Rather than categorizing people primarily by income or age, the model groups them by “lifeworlds”, that is, by how people think, live, communicate, and consume.
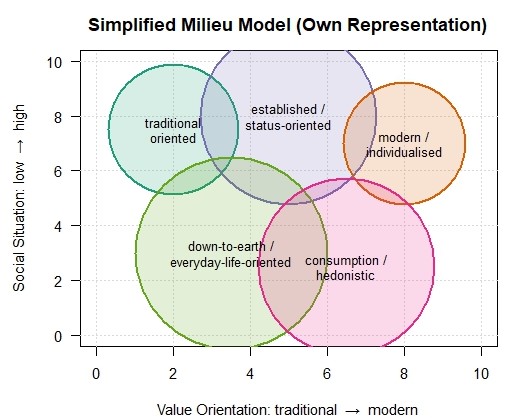
What repeatedly emerges is that music preferences, media use, and cultural activities are milieu-specific. In the project “Der Klang der Milieus“ which means „The Sound of the Milieus”, Sinus published concrete findings on musical tastes. Classical music tends to appear more frequently in certain upper-class milieus, while middle-class groups are more likely to listen to chart pop for example. According to Sinus, lower social strata tend to prefer genres such as Schlager and German rap (Sinus-KIRMES).
You can download the corresponding white paper via the link in the references and check for yourself which milieu your music taste apparently places you in. Perhaps something you were not even consciously aware of until now.
These Sinus data are intended to help companies produce target-group-oriented advertising.
And they also help large language models like ChatGPT to assess users in order to provide optimized output.
This is sensible in theory and statistically sound. However, human groups are usually far more heterogeneous than such models suggest. While this heterogeneity can be captured statistically, it does not generalize well. A short detour into classic statistical curiosities illustrates just how distorted the image of a population group can become.
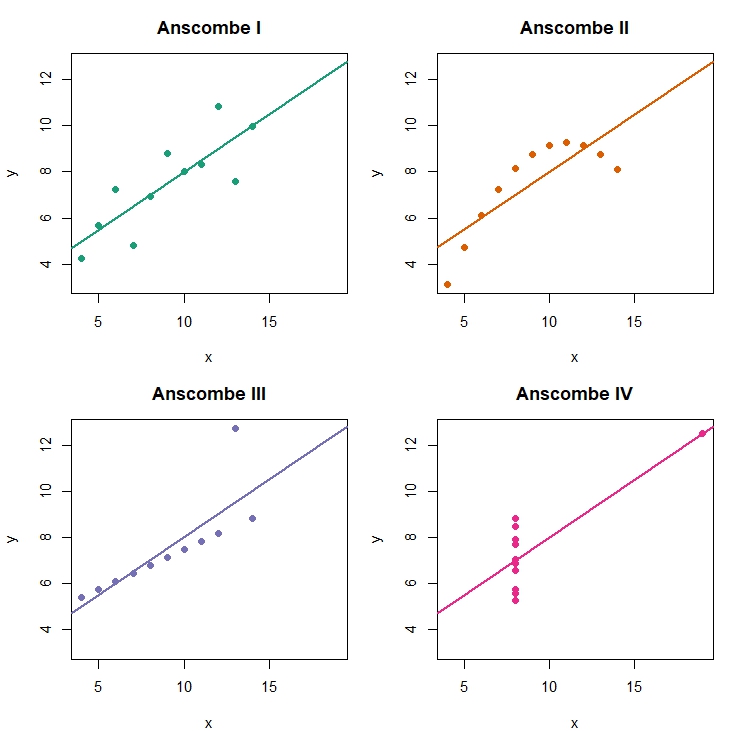
When identical statistics tell completely different stories
Examples such as Anscombe’s Quartet show that datasets with identical statistical properties can look completely different visually and structurally. All four datasets shown here could be interpreted as collections of individual opinions. Each point represents a person positioned in a particular way. Although the four groups or, technically speaking, point clouds differ drastically, they all share exactly the same mean, variance, correlation, and regression line.
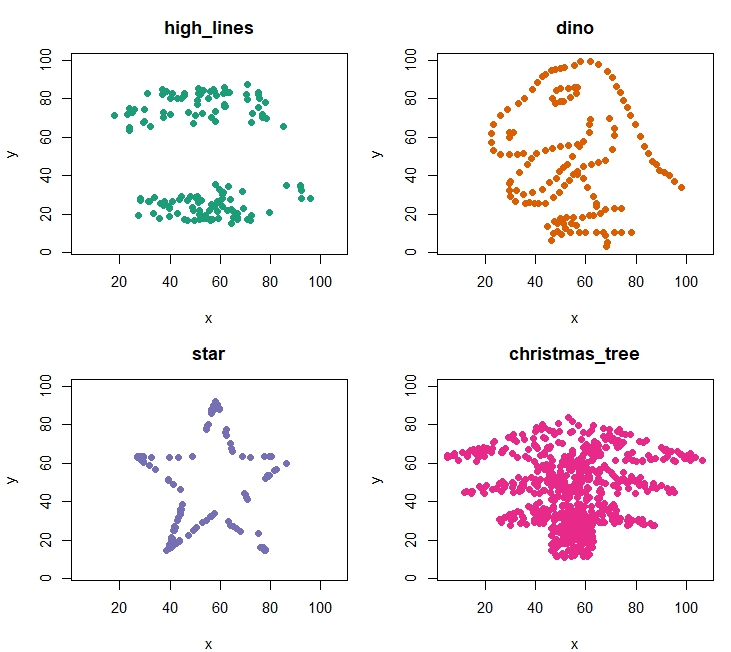
This phenomenon can be extended arbitrarily, with patterns varied at will. Given the season, stars and a Christmas tree seem particularly appropriate.
Language as a social signal
My word choice was also one of the reasons GPT assumed I probably do not like classical music. In sociolinguistics, language is not merely a vehicle for conveying information, but a marker of social belonging (e.g. Bourdieu, Labov). Word choice, tone, level of abstraction, or emotional density often signal more than the literal content itself. One could say that what matters is also what lies “between the lines.”
Terms like “cool,” a sober, functional style of expression, or a focus on efficiency and organization are linked in many datasets to particular lifestyles. Other linguistic patterns, such as aesthetic metaphors or explicit references to cultural practices, correlate statistically more often with different milieus. Language models like GPT learn exactly these associations because such patterns exist in their training data.
And this is where the critical transition occurs. What begins as a statistical tendency quickly becomes an implicit attribution in practical application. This is primarily a matter of efficiency. Models must simplify, cluster, and generalize. This works well as long as it is used and understood for what it is: a probabilistic approximation. It becomes problematic only when this approximation is mistaken for individual truth, when “often” turns into “probably,” and eventually into “this is how it is.”
In my case, the input I provided to the AI “between the lines” led to a cultural misinterpretation, precisely because language itself is statistically legible.
To accuse AI of having prejudices, however, would miss the point. What becomes visible here is a structural limitation of data-driven systems. They are good at identifying patterns, but poor at recognizing exceptions. This is not a flaw, it is the price of aggregation.
As long as we remain aware that such societal milieu data do not represent reality itself, but merely perspectives on reality, data-driven systems can be extremely helpful. But once we forget that identical numbers can conceal very different stories, we begin to smooth over reality. And to overlook diversity. – by Maike Martina Heinrich – Dec 2025.
Title-Photo: Rob Curran, Unsplash (edited by Maike Heinrich)
References:
Anscombe, F. J. 1973. Graphs in statistical analysis. In The american statistician, 27(1), 17-21.
Bourdieu, Pierre. 1991. Language and symbolic power. Harvard university press.
Labov, William. 2006. The social stratification of English in New York city. Cambridge University Press.
Matejka, J., & Fitzmaurice, G. 2017, May. Same stats, different graphs: generating datasets with varied appearance and identical statistics through simulated annealing. In Proceedings of the 2017 CHI conference on human factors in computing systems (pp. 1290-1294).
Sinus-Institut. https://www.sinus-institut.de/sinus-milieus/sinus-milieus-deutschland
Sinus-KIRMES. https://www.sinus-institut.de/media-center/presse/kirmes-artificial-brand-artists

Leave a Reply