
Detecting Pre-Escalation Patterns in Open-Source Conflict Data
Wars, coups, and political ruptures often appear sudden. One day the situation seems tense but manageable, and the next day the world wakes up to a major escalation. Tanks cross borders. Governments fall. Constitutional orders are overturned. But conflicts rarely erupt out of nowhere. Long before the decisive event occurs, something often begins to shift. Political rhetoric hardens. Media attention intensifies. Diplomatic activity accelerates. Small incidents multiply.
In hindsight, these periods often feel unmistakable. People remember that “something was in the air”. The problem is that this intuition is rarely measured systematically. The signals exist, but they are scattered across different domains. Violence data, political events, media reporting, diplomatic statements. Analysts see pieces of the puzzle, but rarely a single picture.
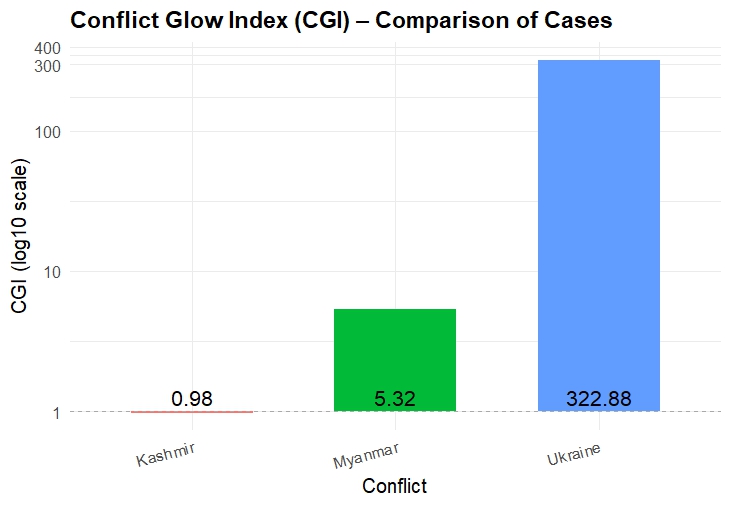
I wanted to measure these weeks before a crisis, this “glow“ before the escalation, not just anecdotally, but empirically. So this led me to develop the Conflict Glow Index (CGI).
The concept is based on a simple observation. Before many major escalations, the surrounding information environment begins to “glow”. Different types of signals intensify at the same time. Violent incidents may increase slightly. Political actors issue more threats or statements. Media coverage becomes more frequent and often more alarmist. Individually, these signals may appear minor. Taken together, however, they can form a visible pattern.
The CGI attempts to capture exactly this phenomenon. It asks how unusual the weeks before a crisis look compared with the conflict’s own recent past.
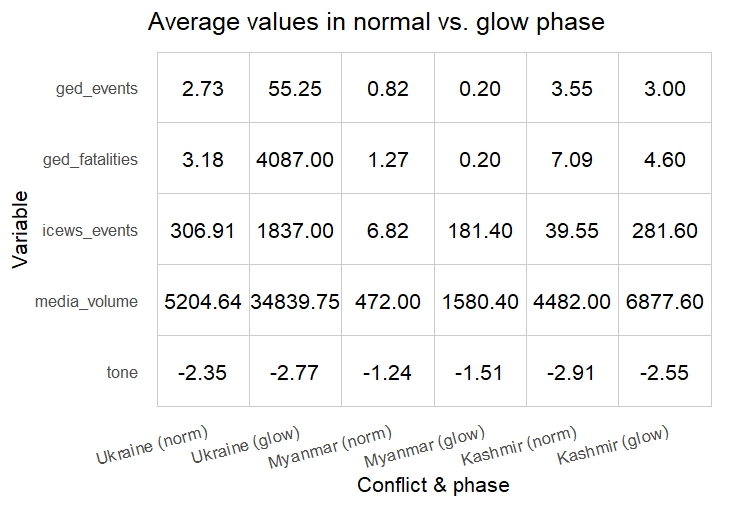
To answer this, the index combines standardized deviations in five domains, organized violence, fatalities, political events, media volume and media tone, using openly available data from three widely used datasets in conflict research, the Uppsala Conflict Data Program’s Georeferenced Event Dataset (UCDP GED), the Integrated Crisis Early Warning System event database (ICEWS) and the Global Database of Events, Language and Tone (GDELT). Taken together, these indicators provide a multi-dimensional view of the conflict environment. The logic is straightforward. If several of these indicators simultaneously deviate from their recent baseline, the pre-crisis period begins to stand out statistically. This difference is what the index describes as “conflict glow.”
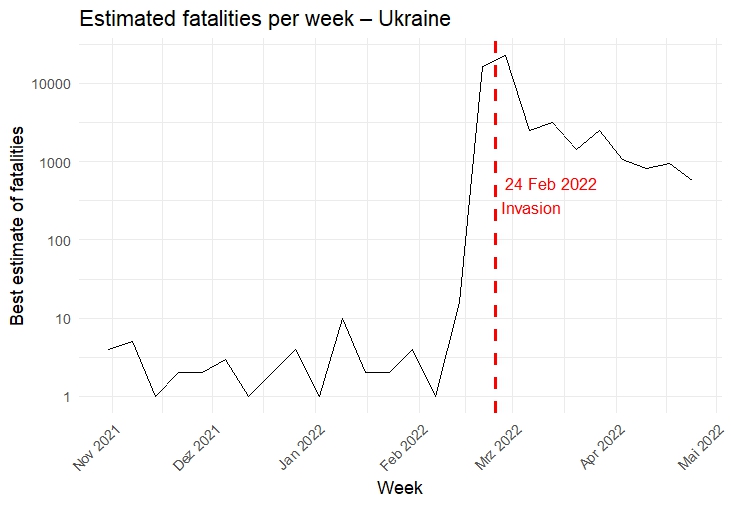
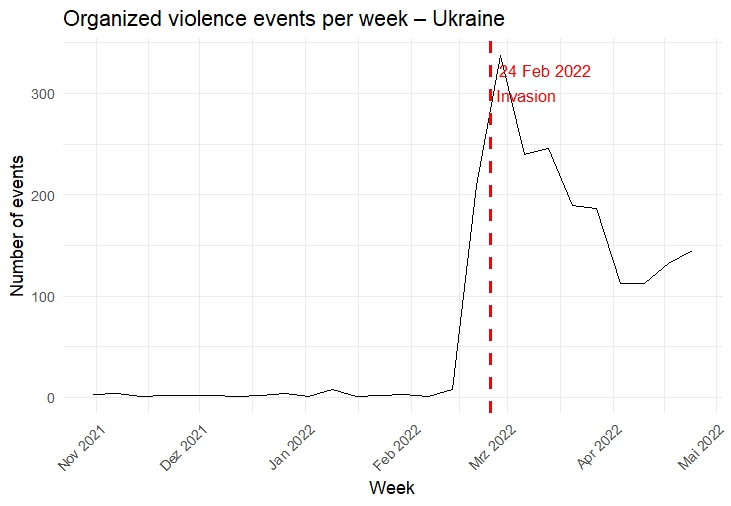
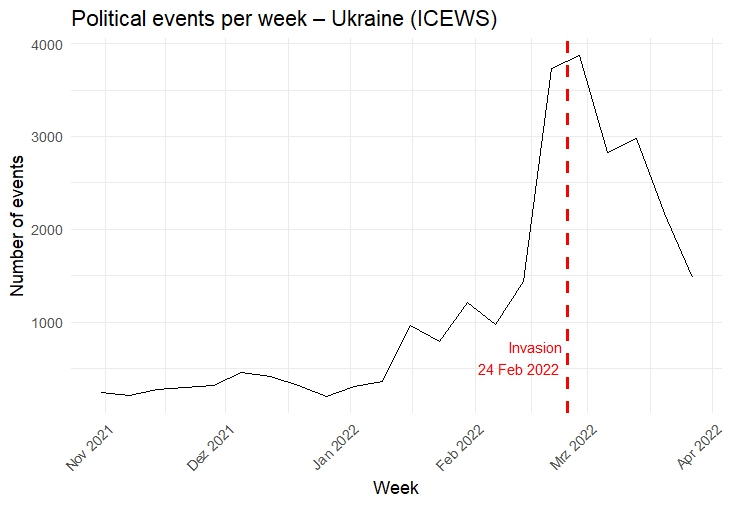
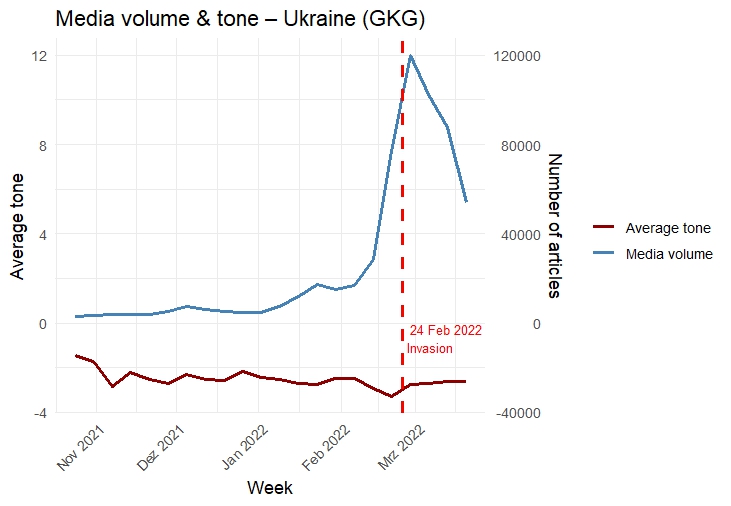
To see how this works, it helps to look at recent examples. In the months before Russia’s full-scale invasion of Ukraine in February 2022, global attention focused increasingly on the region. Diplomatic exchanges intensified, military rhetoric escalated, and media coverage surged dramatically. Even though violence levels in eastern Ukraine remained relatively stable until the invasion itself, the broader political and informational environment showed clear signs of growing tension. In retrospect, the weeks before the attack form a striking example of multi-dimensional escalation signals.
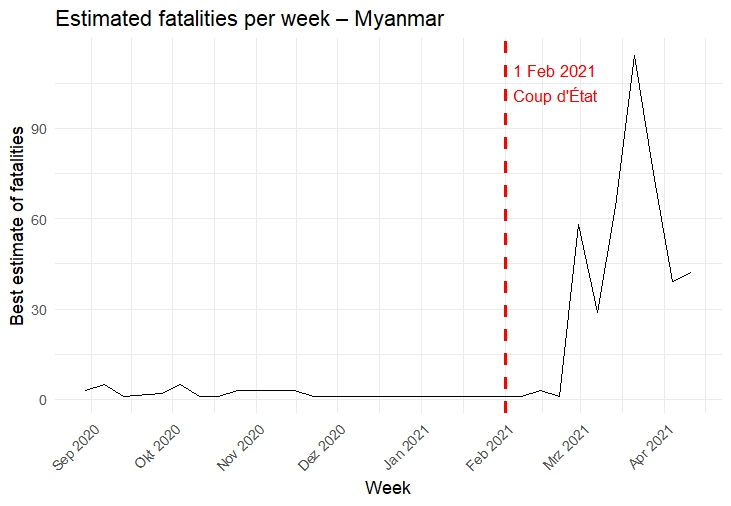
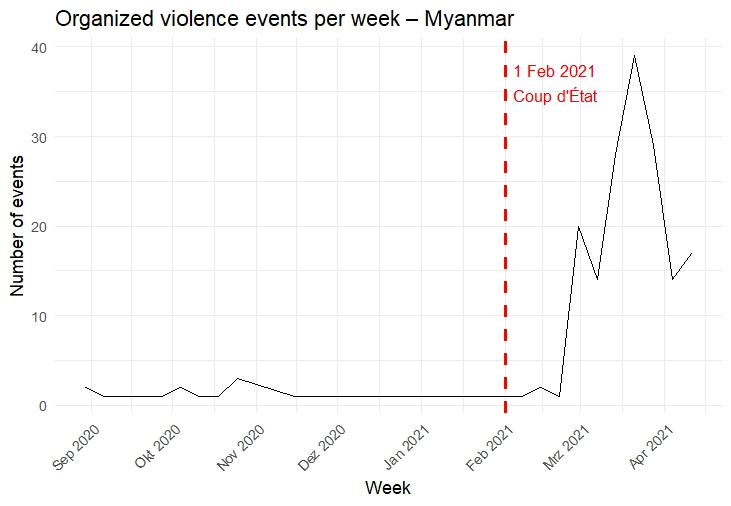
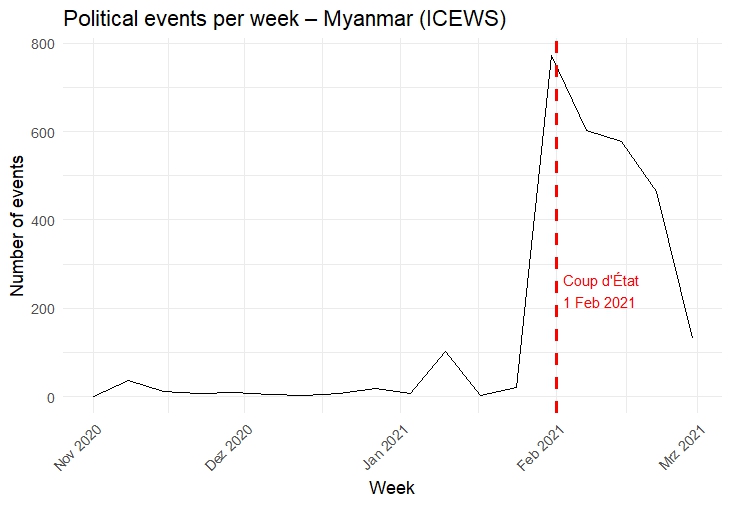
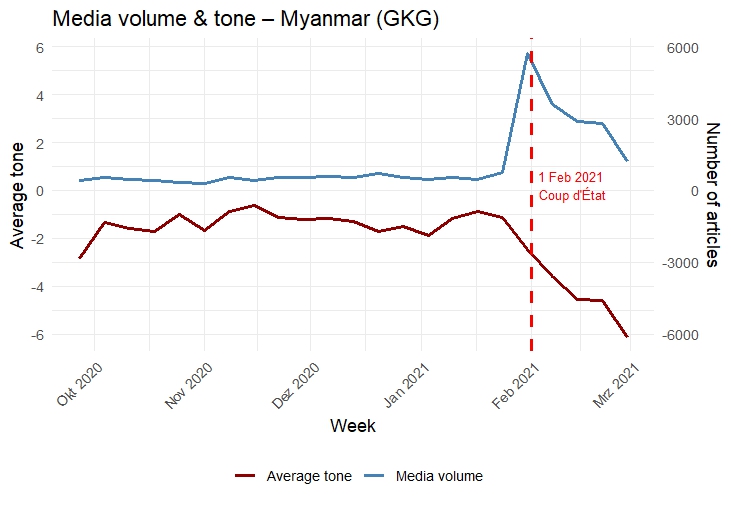
Myanmar provides a different pattern. The military coup of February 2021 was not preceded by large-scale violence. Instead, the crisis unfolded within political institutions and public discourse. Disputes over the election results intensified, accusations multiplied, and international media coverage increased sharply as the possibility of military intervention became more widely discussed. Here, the pre-escalation glow emerged primarily in the political and informational sphere rather than on the battlefield.
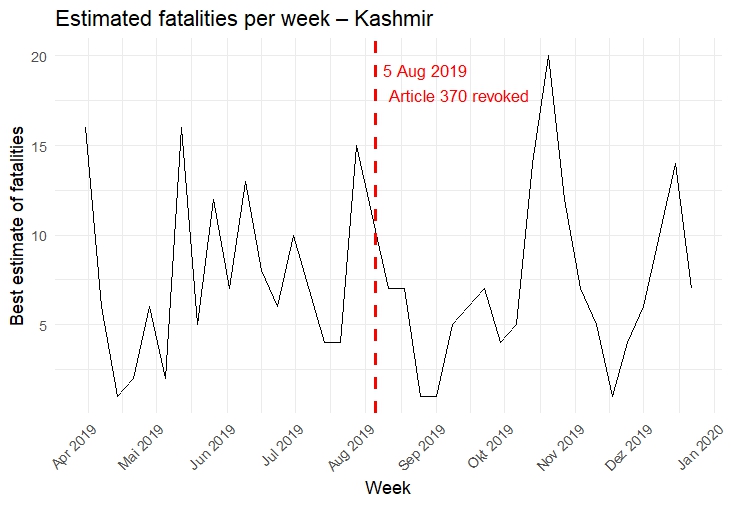
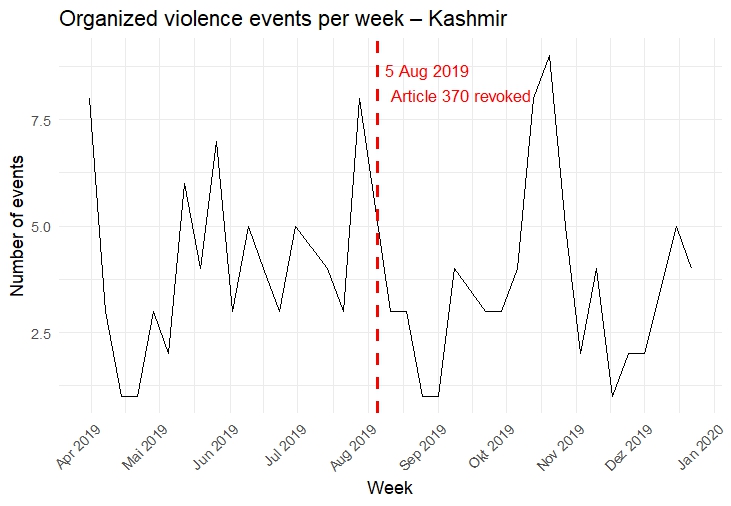
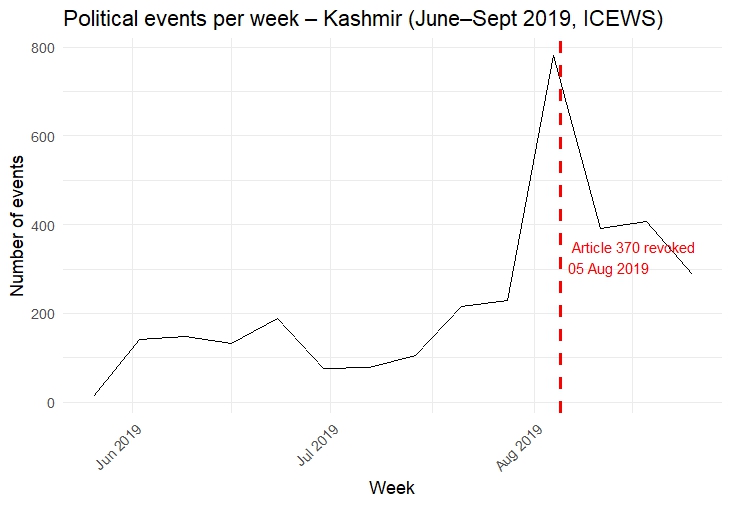
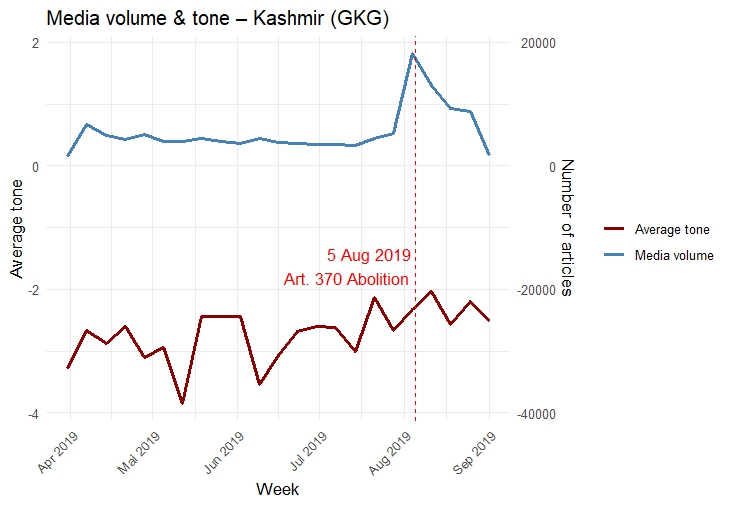
A third case is the revocation of Article 370 in Kashmir in August 2019. The decision fundamentally changed the constitutional status of the region and triggered a sweeping security lockdown. Yet the weeks before the announcement did not show a dramatic rise in armed clashes. Instead, signals appeared through other channels: increased political activity, heightened media attention and administrative preparations. Once again, the escalation was visible in hindsight, but not necessarily through violence data alone.
These examples highlight the important point, that escalations do not always follow the same script. Some crises are preceded by visible military build-ups. Others emerge through institutional manoeuvres, rhetorical confrontation or shifts in public communication. A useful analytical tool therefore needs to capture more than one type of signal.
This is precisely where the value of composite indicators becomes clear. By integrating violence data, political events and media dynamics into a single framework, the Conflict Glow Index makes it possible to observe escalation patterns that might otherwise remain fragmented across separate datasets.
Importantly, the CGI is not intended to function as a predictive early-warning system. Forecasting conflict is an extremely complex task, and many sophisticated models already attempt to estimate long-term risks of instability or violence. The purpose of the CGI is different. Rather than predicting the future, it seeks to describe the present dynamics of escalation. In practical terms, the index measures how strongly different indicators deviate from their recent baseline during the final weeks before a crisis. If multiple indicators rise significantly at the same time, the index registers a strong glow. If only one domain changes while others remain stable, the glow appears weaker or more selective.
This distinction can be analytically useful. It allows researchers, journalists and policymakers to compare escalation environments across different conflicts. Some crises produce broad, highly visible signals across many domains. Others remain relatively quiet until the moment of rupture.
Another advantage of the approach lies in transparency. The index relies entirely on openly available datasets that are widely used in conflict research. Its calculation involves straightforward statistical comparisons rather than opaque machine-learning models. As a result, the logic behind the indicator remains easy to understand and replicate.
Of course, open-source data have limitations. Media coverage varies across regions and languages. Political events may be reported unevenly. Communication blackouts can distort information flows. The CGI does not eliminate these challenges. However, by combining several independent data streams, it reduces the risk that bias in one dataset will obscure meaningful patterns.
Conflicts rarely jump from stability to explosion overnight. They pass through a phase in which political behaviour intensifies, attention grows, and signals accumulate. These signals may not always be obvious in real time, but they often become visible when examined systematically.
Recognizing these patterns does not guarantee that escalation can be prevented. But it may help analysts and observers understand conflicts more clearly while they are unfolding, rather than only after the fact. In that sense, the glow metaphor is not just descriptive. It also reflects a broader challenge in conflict analysis. Escalations often give off warning signs before they occur. In various ways. Combining these signals can make the escalations clearly visible. – by Maike Martina Heinrich – March 2026.
Read the full CGI paper on https://www.academia.edu/165169055/The_Conflict_Glow_Index_CGI_Detecting_Pre_Escalation_Patterns_in_Open_Source_Conflict_Data
Title Photo: Wahaj Bani Moufleh on Unsplash
References:
Boschee, E., Lautenschlager, J., O’Brien, S., Shellman, S., Starz, J., & Ward, M. (2015). ICEWS coded event data. Harvard Dataverse. https://doi.org/10.7910/DVN/28075 (Accessed: October 25, 2025)
GDELT Project. Global Knowledge Graph (GKG) documentation. https://www.gdeltproject.org/ (Accessed: October 20, 2025)
UCDP. (2023). Uppsala Conflict Data Program – Georeferenced Event Dataset (GED), Version 24.1. Uppsala University. https://ucdp.uu.se/ (Accessed: October 20, 2025)

Leave a Reply